Search box
Microbiology Concept Inventory
Please note, you must be an educator in higher ed or maybe high school to qualify to recieve the MCI
Chapter 6 - Selected aspects of bacterial growth and nutrition
6 - 1 Bacterial nutrition
The growth of any microorganism, whether in its natural niche or in a laboratory, is dependent upon the presence of certain essential compounds in its environment. In the lab all these components must be provided for in the culture medium for the organisms to grow. The potential composition of media is as diverse as the number of microorganisms under study. This section discusses the basic requirements for all organisms and the components of culture media. If you want to know more about microbial requirements for growth, read the chapter on bacterial nutrition in your microbiology textbook
A fundamental and often ignored ingredient in all growth media is water. Water is an amazing compound. It is the only natural substance found in all three states; liquid, solid and gas at temperatures commonly found on earth. Water has a high specific heat index and can hold a large amount of heat. Water is the universal solvent, dissolving many more substances than any other liquid. All biological reactions take place in water. Its unique properties allowed the development of life on this planet. When humans discover life on other planets, life forms will likely be water-based. Besides being the solvent of choice, water can also donate H or O to certain reactions, but this contribution is minimal. In the preparation of most culture media, the first ingredient added is water.
The second most important ingredient added to media is the carbon source. For many of the media we will use in this course, an organic compound, such as glucose, will serve as the carbon source. However, this is not always the case. Autotrophs will utilize CO2 for cell carbon and the medium used for the growth of some autotrophs consists of just a few salts. In many cases the carbon source will also serve as the source of energy. E. coli, growing in a minimal glucose medium utilizes the glucose both as carbon and energy source. In other cases, another source will be used to generate energy, including inorganic compounds and light.
Carbon is not the only element needed in relatively large amounts by microorganisms. Hydrogen, oxygen, nitrogen, phosphorous, sulfur, and potassium are usually provided in a culture medium. Some microbes can assimilate these elements in their most simple form (i.e. O2, H2,or N2), while in other cases they have to be provided as a part of a larger molecule (KNO3, amino acids, MgSO4). Other elements that are also essential, but are not added in as large a quantity include, magnesium, iron, calcium, and potassium. Whatever the source, all these elements must be provided to support growth.
Components of Media and its Classification
Since the list of growth requirements is quite extensive, providing all of them to a microorganism in a culture medium would seem complicated. In practice, most media is easy to make, but some formulations can be tremendously difficult. The ingredients added to culture media can range from pure chemical compounds to extracts and digests of plant or animal tissues. If all the components of a medium are known both qualitatively and quantitatively, it is referred to as chemically defined medium. This type of medium is often used to study the nutritional requirements of an organism or is necessary when elucidating various metabolic processes. Complex medium contains components that are extracts or digests whose exact chemical composition is impossible to determine and often varies from lot to lot. Therefore the exact amount of ingredients in complex medium is generally unknown. Common extracts and digests used in the preparation of microbial medium include; brain heart infusion (boiled, concentrated cow brains and hearts), yeast extract (killed and purified, dehydrated yeast) and various peptones (a digest of certain plant and animal proteins). These complex materials can provide carbon and energy sources, all necessary minerals, and growth factors (known and unknown) to an organism. Complex medium is often used in diagnostic tests, since they often provide all necessary components for growth of many different microorganisms.
Media used in the cultivation of microorganisms can also be classified according to the way in which it is used.
- A medium that contains only the minimal components necessary for growth of a microorganism is termed a minimal medium. This type of medium can be simple, containing a few salts ((NH)4SO4, KH2PO4, MgSO4) and a carbon source (glucose). Minimal medium can also be extremely complex. A medium formulated for the growth of Leuconostoc mesenteroides, a fastidious organism, contains glucose, 7 salts, 19 amino acids, 4 nucleotides, and 10 vitamins.
- All purpose media are able to support the growth of a wide variety of microorganisms. These media are usually complex. Some examples of all purpose media include; Brain Heart Infusion Broth, All Purpose Tween (APT), Penassay agar and Luria Broth.
- Some media contain ingredients that inhibit the growth of a certain class of microorganisms. For example, MacConkey's Agar contains bile salts and crystal violet to inhibit most gram positive microorganisms. This type of medium is termed selective medium, since it selects for a certain class of microorganisms. Other examples include Eosin Methylene Blue (EMB) Agar and Lactose Lauryl Tryptose Broth.
- Differential media help us distinguish between different groups of microorganisms by some biochemical or physiological criteria. This type of medium is useful in identifying the genera of microorganisms under study. Examples of this type include MacConkey's agar sugar fermentation broths, and Kliger's Iron Agar.
If a solid medium is necessary, agar is usually added as the solidifying agent. For plates or slants, a 1.5% concentration of agar is typical. For semi-solid medium < 0.5% agar is employed. Agar is a complex, long chain polysaccharide derived from certain marine algae and has several useful properties. When added to a solution, it melts at 100 °C forming a slightly viscous liquid that solidifies at ~43 °C. After solidification, the agar will not melt unless the temperature is again raised to 100 °C. This is a tremendously useful property as you will discover later in the semester. Some other useful properties of agar include its resistance to microbial degradation and its translucence for easy viewing of colonies embedded in the agar. One important disadvantage of agar is its tendency to harbor impurities, which are virtually impossible to completely extract. With certain organisms, these impurities can sometimes interfere with nutritional studies, and even inhibit growth. Chemically defined medium that contains agar must technically be considered complex. If agar presents a problem in certain studies, silica based solidifying agents are usually used as a substitute.
We owe the adoption of agar as a solidifying agent in microbiology to Fanny Eilshemius Hesse. Robert Koch and her husband Walter Hesse were searching for a method of culturing microorganisms on solid surfaces. Walter had tried using potato slices and solidified gelatin, both with unsatisfactory results. In 1881, Fanny suggested he try agar (a thickener she often used in cooking). With this new solid medium, Walter was able to develop pure culture techniques and discover the causes of many diseases, including tuberculosis.
Sterilization of Media
In almost all cases, once a medium is made, it must be treated to eliminate any microorganisms contaminating containers, media ingredients, weighing papers, or other surfaces that come in contact with the medium. If this is not performed correctly, contaminates arise during incubation, making microbiological investigations impossible. Sterilization is defined as the inactivation (or removal) of all life forms (including the pseudo-life forms, viruses) in a specific area. Culture media must be made sterile without inactivating nutrients necessary for growth of the microorganism. Equipment and media used in the microbiology laboratory are most often sterilized using one of the methods listed in Figure 5-14.
Figure 5.14. Sterilization of media. Some common methods for the sterilization of media and instruments. The methods used depends upon the material and its intended use.
6 - 2 Protocol for making media
Period 1
Materials
13 tubes of Nutrient Broth
2 250 ml flasks
1 graduated cylinder (100 ml)
magnetic stirrer and stir bar
scales and weighing paper
8 empty sterile Petri plates
1 tube of 50% glucose (2 ml)
1 bottle of 3% Agar + MgSO4 (50 ml, melted in 50 °C water bath)
Media ingredients (as listed below)
| Minimal Medium - Part A | g/L | Nutrient Agar | g/L | |
|---|---|---|---|---|
| Ammonium Sulfate | 7.0 | Beef Extract | 5.0 | |
| Dipotassium Phosphate | 7.0 | Peptone | 3.0 | |
| Monopotassium Phosphate | 3.0 | Agar | 15.0 |
| Minimal Medium -Part B | g/100 ml |
|---|---|
| Agar | 3.0 |
| Magnesium Sulfate | 0.02 |
| Minimal Medium Part C | g/100 ml |
|---|---|
| Glucose | 50 |
To become familiar with what goes into mixing up a batch of medium, 4 plates of a minimal medium and 4 plates of a complex medium will be prepared.
- Go to one of the designated measuring areas and weigh out each component required for the Minimal Medium - Part A. Use the recipe listed above. Note: The above recipe is in grams/liter and you are making 100 ml not 1 liter of each medium.
- Carry the measured amounts back to your lab bench. Use the graduated cylinder to measure 50 ml of distilled water (dH2O) and pour this into one 250 ml flask.
- Add the first ingredient on the list, gently swirl the flask, and let it dissolve completely. Then add the next ingredient. Continue until all ingredients have been added. When finished, place a foam plug in the flask.
- Fill the other 250 ml flask with 100 ml of dH2O. In this case we are using a dehydrated ready-made medium. Weigh out an appropriate amount of Nutrient Agar powder, add it to the flask, and swirl. That's it! Many types of media come in dehydrated, premixed form. They are convenient and cheap. Which brings up a rule to remember, scientists always try to make necessary chores, like media making, as quick and convenient as possible, thus freeing their time for more fruitful pursuits.
- Place the finished medium in the trays provided. When everyone is finished, attend the autoclaving demonstration. Autoclaving will take about 45 minutes total. During the waiting period, perform the other experiments scheduled for today.
- When the medium is sterile, place it in the 50 °C water bath to cool down. The minimal medium needs some additions (a carbon source and agar). Once the minimal medium is cool, add 0.4 ml of 50% glucose (Minimal Medium - Part C) to the medium and 50 ml of Minimal Medium - Part B (This is pre-made and is located in the 50 °C water bath). Swirl the flask and pour the now complete Minimal Medium into 4 plates. Also, swirl the Nutrient Agar flask and pour 4 plates.
- Let the plates cool and when completely solidified place them in your lab bench drawer, upside down, until next period.
Period 3
Materials
2 plates of Minimal Medium (MM)*
2 plates of Nutrient Agar (NA)*
Cultures for streaking

Figure 5.1. A picture of plates prepared plates. The appearance of plates after they are made. The minimal medium is colorless (left), while the nutrient agar is tan (right).
*Prepared last period by students
Media Making
- Bring out your plates of MM and NA. Examine them for contamination. If any colonies are present, do not use that plate. If you're unsure, have the instructors check them.
- To test the microbial acceptance of your media, streak the supplied culture for isolated colonies using a plate of minimal medium and rich medium.
- Incubate all tubes at 30 °C.
6 - 2 Classic strain testing
Oxygen has a tendency to form very reactive by-products (H2O2 and O2-(superoxide)) inside a cell. These by-products create havoc by reacting with protein and DNA, thus inactivating them. Cells that are able to live in the presence of oxygen have evolved enzymes to cope with H2O2 and O2- and thus are not inhibited by O2. Also many anaerobes have oxygen labile Fe-S centers and no cellular machinery to protect them from the oxidizing power of oxygen. Organisms that cannot deal with the problems presented by oxygen cannot survive in air and are killed.
On the basis of oxygen tolerance, microorganisms can be placed into four classes. Strict aerobes cannot survive in the absence of oxygen and produce energy only by oxidative phosphorylation. Strict anaerobes, in many cases, generate energy by fermentation or by anaerobic respiration and are killed in the presence of oxygen. Aerotolerant anaerobes generate ATP only by fermentation, but have mechanisms to protect themselves from oxygen. Facultative anaerobes prefer to grow in the presence of oxygen, using oxidative phosphorylation, but can grow in an anaerobic environment using fermentation.
Oxygen utilization is a primary diagnostic tool when identifying microorganisms. Special media has been developed for the purposes of determining the oxygen relationship and method of metabolism (fermentation vs. respiration) of microorganisms. One such medium, Thioglycollate Agar is useful for determining the oxygen relationship of a microorganism. The medium contains thioglycollic acid, cystine and 0.35% agar, among other things. The thioglycollic acid and agar prevent oxygen from entering the entire medium. A dye, resazurin, is used as an indicator of the amount of oxygen in the medium. Resazurin is red in the presence of oxygen and turns colorless under anaerobic conditions. The medium is steamed just before use, which removes all oxygen from the tubes. After inoculation and incubation, oxygen is able to diffuse into the top part of the medium and support growth aerobically, while the bottom half of the medium remains devoid of oxygen.
A second medium used to investigate the general type of metabolism used by a microorganism is glucose O/F medium. This is a rich medium that contains glucose as primary carbon source. A pH indicator dye, brom thymol blue, is added and is green/blue under alkaline-Oxidative conditions or yellow under acidic-Fermentative conditions. Each test organism is inoculated into two tubes of glucose O/F medium. One tube is overlaid with mineral oil and the other is not. The mineral oil serves as a barrier to oxygen, which helps to create an anaerobic environment.
In this experiment you will first investigate the reactions of several known microorganisms having different types of metabolism. You will determine the characteristic reactions of thioglycollate medium and glucose O/F medium. You will then use this information to determine the oxygen relationships and catabolism type of your two unknown isolates.
Protocol for testing oxygen relationships
Period 1
Materials
8 tubes of Glucose O/F Medium
4 tubes of sterile mineral oil
4 tubes of Thioglycollate Agar (melted, in 50 °C water bath)
Cultures of
Pseudomonas fluorescens
Clostridium sporogenes
Enterococcus faecalis
Escherichia coli
2 plates of Brain Heart Infusion Agar
Anaerobe jar
In this exercise we will be first testing the oxygen relationships of some known organisms in Glucose O/F medium and Thioglycollate Agar. This will give you a sense of inoculating test media and allow you to observe their characteristic reactions.
- Get four tubes of thioglycollate agar from the 50 °C water bath. The thioglycollate agar has been steamed for several minutes to drive off any oxygen. Keep the agar melted by incubating the tubes in a container containing 50 °C water. Label the tubes with the culture names.
- Inoculate each culture into one tube of Thioglycollate agar. Mix the tubes by placing the palm of your hand over the top of the tube and moving the bottom of the tube in a circular fashion.
- Incubate the tubes at 30 °C for 2-5 days.
- Inoculate each culture into two tubes of glucose O/F medium by stabbing the medium the full length of the tube with the inoculating needle.
- Overlay one tube of each culture of Glucose O/F medium with 2-3 cm of mineral oil. What is the purpose of the mineral oil? Incubate at 30 °C for 2-5 days.
- Divide each plate into four sectors. Label one plate aerobic and the other anaerobic. Streak each culture onto one sector on each of the plates.
- Incubate one plate aerobically at 30 °C. Place the other plate in the anaerobe jar. The air will be evacuated and replaced with H2 + CO2 atmosphere. The jar will also be incubated at 30 °C.
Period 2
- Observe the thioglycollate tubes for the known cultures. Notice the growth pattern of each organism. Is growth seen throughout the tube? Is there more growth at the top of the tube? What does that mean? Did any of the cultures exhibit growth only in the bottom of the tube?
- Make drawings of each test tube culture in your lab notebook. From looking at the tubes can you infer which organisms are strict aerobes, facultative anaerobes, aerotolerant anaerobes or strict anaerobes? Record this information in your lab notebook.
- Observe the Glucose O/F medium. Look for growth in the tubes and production of acid (yellow color). Bacteria that grow only in the tube without mineral oil have a respiratory form of metabolism. Bacteria that grow in both tubes and produce acid under anaerobic conditions can also use fermentation. What would be the reaction of a strict aerobe in this medium? Record the results in your notebook. Do the results obtained here agree with the results from the thioglycollate experiment?
- Observe the BHI plates. Record anaerobic and aerobic growth as + or -. Do the results here agree with that which was observed for the other media in this experiment.
- Catalase test. Add several drops of (H2O2) to each area of growth on the plates incubated aerobically. Observe through the top lid of the closed plates so you don't cause an aerosol of live cells to spread from a positive reaction! A positive reaction is indicated by the constant evolution of bubbles. Figure 5-15 is a movie of the catalase test for these six microbes. However, C. butyricum cannot be tested, why?
Figure 5.15 the catalase test
Figure 5.3. Motility of a gliding bacteria. The gliding motion of a Paenibacillus species on a solid surface. Note the gliding motion of the cells across the screen.
6 - 3 Streptomyces
Streptomyces are gram positive, spore-forming bacteria found in soil. They are characterized by their tough, leathery, frequently pigmented colonies and their filamentous growth. When first discovered, these organisms were thought to be fungi, but closer examination revealed a lack of a nuclear membrane and the presence of peptidoglycan, demonstrating their prokaryotic origin. Streptomyces are chemoheteroorganotrophs, growing best at 25°C and pH 8-9. They are capable of using complex organic materials as carbon and energy sources and are involved in the breakdown of these products in the soil. This degradative ability makes these bacteria pivotal in the production of fertile soil for agriculture. They also give soil its characteristic smell by the production of a class of volatile low molecular weight compounds called geosmins.
In the laboratory, different isolates were found to produce numerous compounds capable of inhibiting or killing other microorganisms. Many of these Figure 10-3 shows some examples of streptomycetes
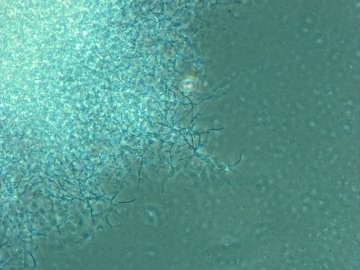
Figure 10.3. An example of streptomycetes. A photomicrograph of Streptomyces vegetative cells and spores.
In this section, we describe the enrichment of this group of organisms and test several isolates for their antibiotic producing ability. Dried soil, a great source of inoculum for Streptomyces, will be plated directly onto Actinomycete Isolation Agar (AIA). Since an enrichment step is not necessary, what does that tell you about the population of Streptomyces in the soil? AIA contains starch and sodium caseinate as sole carbon and energy sources. Only organisms capable of degrading these complex polymers (mostly molds and streptomycetes) are able to grow. Sodium propionate (a preservative sometimes present in commercial bread) is added to inhibit the growth of molds. Incubation at 30°C for more than five days results in the formation of Streptomyces colonies that are recognized by their characteristic appearance.
Isolation protocol
Period 1
Materials
Soil sample
3 0.85% NaCl dilution blanks (9 ml)
3 plates Actinomycete Isolation Agar (AIA)
- Weigh out one gram of soil and place it in one of the dilution blanks. Vortex the suspension for 1 min. Serially dilute the suspension to 10-3 using the other 2 saline dilution blanks.
- Label the 3 plates of AIA, 10-1, 10-2, 10-3 and 10-4. Plate 0.1 ml from each of the 3 dilution blanks onto the appropriate plate of AIA and spread the inoculum using a sterile hockey stick.
- Incubate the plates at 30°C for 5-7 days.
Below is shown the appearance of a Streptomyces isolation plate after 5 days of incubation
Period 2
Materials
5 AIA plates
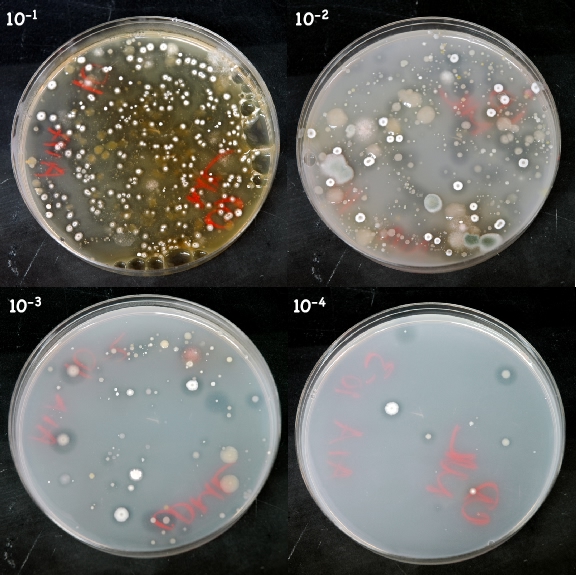
Figure 10.4. AIA after incubation. This AIA plate was inoculated with soil from near Hayward Wisconsin. The plate was incubated at 30°C for one week. Streptomyces species are the white and colorful chalky looking colonies.

Figure 10.5. A closeup of a typical streptomyces colony. Note the colorful chalky/dusty appearance. The colony is hard, not gummy, and does not easily lift from the agar.
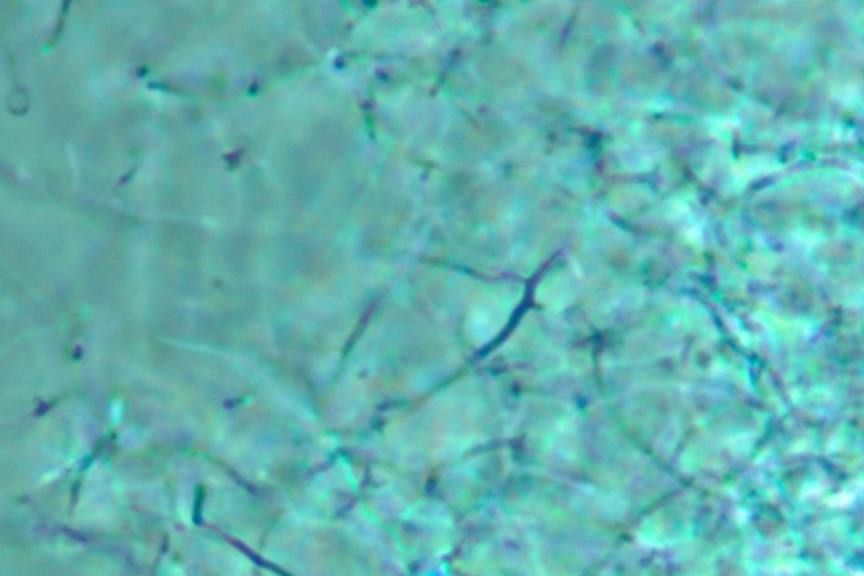
Figure 10.6. A wet mount of a Streptomyces colony. A Streptomyces colony under the phase microscope. Notice the long branched hyphae in the picture. This picture was taken at 1000x and enlarged 2 fold.
- Examine the AIA plates and look for typical Streptomyces colonies, Figure 10-2. They are small, opaque, compact, frequently pigmented (brown, yellow, pink, etc.), often leathery, and appear dry and dull looking. See Figure 10-3 for examples. Typically, a depression in the agar surface will be observed around the colony. Avoid molds. They usually form much softer, fuzzy colonies if present. AIA has propionic acid in it to inhibit most molds, but some species are resistant to this inhibitor.
- Prepare a wet mount. Good Streptomyces candidates will be difficult to remove from the agar with the inoculating needle or loop and upon observation under the microscope will reveal a multitude of spores with a few filamentous cells, Figure 10-6.
- Select five potential Streptomyces colonies and streak each for isolation onto a plate of AIA. Incubate the plates at 30°C for 5-7 days.
Period 3
Materials
6 plates of Penassay Agar
Culture of Streptomyces griseus, an active antibiotic producer

Figure 10.7. Streaking pattern for the antibiotic test. Diagram of the appropriate streaking technique for the Penassay plates. (A) The placement of the Streptomyces colonies. (B) The placement of the test cultures. Note that there is a 5-7 day incubation between streak A and streak B.
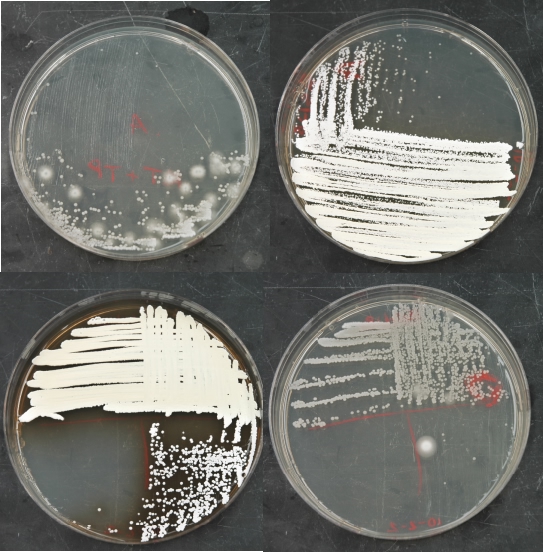
Figure 10.8. Streaks for isolated colonies on penassay agar. The appearance of penassay agar after streaking for isolated colonies of Actinomycetes.
- Examine each Streptomyces isolate and describe its colony morphology. Verify that it is indeed free from mold, Figure 10-7.
- Pick a well isolated colony from each plate and streak onto Penassay Medium. Place a single streak down the middle of the plate for each isolate; do not streak for isolated colonies (Figure 10-6). The test cultures will be added to the Penassay plate next period. Also streak a plate of the known culture of S. griseus onto the last Penassay plate in a similar manner. Incubate at 30°C for 5-7 days.
Period 4
Materials
Broth cultures of 5 test organisms
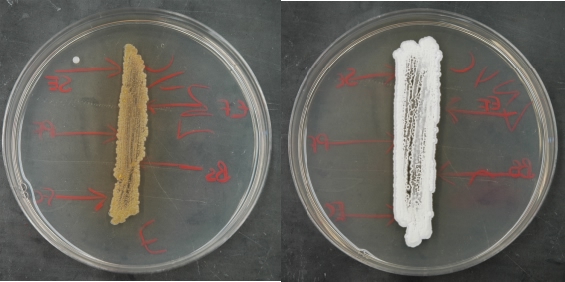
Figure 10.9. An appropriately grown test plate. Example plates after growth of the Streptomyces test strains. Note the full growth completely along the streak line. There is a minor contaminant in the left sample, but it should not interfere with analysis.
- Examine the plates for growth and freedom from contamination. Check the cultures for the production of geosmins (the smell we associate with soil) by carefully smelling the plates along the edge while leaving the plates closed. Figure 10-9 shows some examples of a good test plates
- Cross-streak the plates with each of the 5 test cultures. Start each streak near the edge of the plate and streak toward the Streptomyces colony (Figure 10-6). Finish the streak near, but not touching, the Streptomyces streak. Do not reverse the direction of the streak and only streak one time!
- Incubate at 30°C for 2 days
Period 5

Figure 10.10. Antimicrobial production by isolates. Examples of microbes that have been isolated and their inhibition of test microbes. Isolate 3 is secreting a brown metabolite into the medium. Isolate 4 is secreting an antimicrobial into the medium that is inhibiting S. epidermidis, E. faecalis, and B. subtilis. Ec - E. coli, Pf - P. flourescens, Bs - B. subtilis, Se - S. epidermidis, and Ef - E. faecalis.
- Observe the S. griseus plate and look for growth inhibition in the test cultures due to antibiotic production. If a test culture is inhibited, there should be a decrease in the amount of growth as you move in toward the Streptomyces streak. Examine your Streptomyces, do any of the isolates show production of antibiotics. Figure 10-10 shows an example of a Streptomyces isolate that inhibit several strains.
- Examine the plate above. Are any of the isolates antibiotic producers? What further tests would need to be done to find out?
6 - 3 Tomato Wilt in Plants
This content has been removed
6 - 4 The different kinds of motility in microbes
Motility in bacteria is achieved by any of several mechanisms. The most widespread mechanism is flagellar movement which allows travel in a liquid medium and is mediated by special threadlike organelles extending from the cell surface called flagella. Most rods and spirilla are motile by means of flagella; cocci are usually non-motile. A somewhat modified version of the bacterial flagellum is responsible for the movement of the bacteria known as spirochetes. These organisms possess an axial filament, consisting of two sets of flagella-like fibrils anchored at the two poles of the cell. Another type of movement observed for bacteria is known as gliding motility. It is the sole method of move-ment for certain of the cyanobacteria and myxobacteria. These organisms can move slowly over solid surfaces. Motility seen for any organism in this course will be due to flagella, the main focus of this experiment.
Virtually all bacteria which possess flagella are motile. Flagellation is a genetically-stable morphological trait of these cells. Certain environmental and nutritional conditions favor flagellar movement which can cease with increasing age (of the culture), temperature and concentration of waste products. Thus, optimal conditions for growth of the organism should be provided when one wishes to detect motility. The presence of flagella, as well as their number and distribution on the cell, are important characteristics for purposes of identification and classification of bacteria. When one or more flagella arise only from one or both ends of a rod or spiral-shaped cell, the arrangement is termed polar. When flagella arise randomly over the entire surface of the cell, the arrangement is termed peritrichous.
Motility is important in that an organism can swim toward optimal concentrations of nutrients and away from toxic substances. As an organism moves (runs), stops (twiddles), moves off in another direction, stops, etc. - in what superficially looks like a random fashion - one finds that the longest runs are in the direction toward the nutrient or away from the toxic substance. This type of purposeful movement is called chemotaxis. Other forms of tactic response include phototaxis (movement toward optimal light concentration or wavelength) and magnetotaxis (orientation and movement along lines of magnetic force). For more information of motility, see the chapter in the microtextbook on surface structures
Unlike flagella of eucaryotic cells (protozoa, algae, etc.), bacterial flagella are beyond the resolving capability of our lab microscopes. Flagella stains have been developed which coat the flagella to make them visible with the microscope and much practice is necessary to get consistently good results. Were we to have access to an electron microscope, we would be able to see the flagella (if present) and their arrangement for the organisms in this and other experiments in this course.
In our lab, determining the presence or absence of flagella is done by indirect methods, as we detect whether or not motility is evident under growth conditions made as favorable as possible for the organisms. With the wet mount, an actively-growing, young culture is required for observation. Motile organisms are usually easily seen as they move among each other in separate directions. One must, of course, discount Brownian motion, the movement due to bombardment of submicrosopic particles in the liquid, where the cells (alive or dead) appear to remain in one position but shake somewhat. One must also not confuse true motility with movement in a current of liquid where all cells (again, alive or dead) appear to be swept in one direction. We will also utilize tubes of Motility Medium wherein only motile bacteria can move away from the line of inoculation in the low (0.5% or less) concentration of agar; descendants of cells which have migrated throughout the medium show up as evidenced by turbidity (cloudiness) in the medium. One advantage of using Motility Medium is that a culture of any age can be used for inoculation - as long as it is pure and viable! In observing the tubes, one must always ignore growth at the surface of the medium and also between the medium and the wall of the tube. Such growth is not necessarily evidence of actual motility. Certain motile organisms, such as many which are strict aerobes, may grow with difficulty in the depths of the medium and ultimately give a false-negative reaction. Generally, one seeks to confirm microscopically any negative reaction seen in the tube.
6 - 5 Growth of microbes in batch culture
The Phases of Growth
Growth in the bacterial context is normally described as an increase in cell number. Microorganisms, depending upon the specific species, increase their numbers by binary fission, budding or by filamentous growth. Binary fission is the separation of the initial cell, the mother cell, into two daughter cells of approximately equal size. This is a very common method of multiplication and most of the organisms we will investigate divide in this manner.
Figure 5.8. The various forms of division. Cells can increase in number by binary fission, budding or filamentous growth. This animation demonstrates each of these processes.
Budding division involves the asymmetric creation of a growing bud, on the mother cell. The bud increases in size and eventually is severed from the parental cell. After division is complete, the mother cell reinitiates the process by growing another bud. Yeast and some bacteria (Caulobacter is one example) use this form of division.

Figure 5.9. Budding cells. A picture of Histoplasma capsulatum var. duboisii cells, a yeast that causes histoplasmosis, in the process of budding. Picture courtesy of Dr. Libero Ajello and the Centers for Disease Control and Prevention.
Filamentous growth is characterized by the formation of long, branching, non-divided filaments, containing multiple chromosomes. Sometimes the filaments will have cross walls separating chromosomes. As growth proceeds, the filaments increase in length and number. Under nutrient limiting conditions, some filamentous microorganisms will go through developmental changes, with a fraction of the filaments differentiating to form spores. The structures and mechanisms used to form these spores can be spectacular. Streptomyces species and many molds grow in this manner.

Figure 5.10. Filamentous growth. The bacteria Nocardia asteroides. Note the long branching cells and the circular spores in the picture.
The best characterized type of growth is binary fission and this is what we will focus on in this experiment. When grown in liquid medium, bacterial cultures progress through several distinguishable phases, which can be characterized by plotting the log of the cell number vs. time. Figure 5-12 shows an example of a typical growth curve with the 4 phases of growth, lag phase, exponential growth phase (also termed balanced growth), stationary phase and death phase.

Figure 5.11. Binary fission. As a cell divides by binary fission, a cross-wall is formed to separate the daughter cells. In this EM of Staphylococcus aureus, the cross-wall is already formed to divide the cells.

Figure 5.12. A bacterial growth curve. A bacterial growth curve generated from actual data obtained in the teaching laboratories at the University of Wisconsin-Madison. The four phases of growth (lag (1), exponential (2), stationary (3) and death phase(4)) are labeled.
When an organism is inoculated into a fresh medium, it needs to adapt to the new nutrients available, synthesize RNA, protein and finally replicate its DNA before starting division. These processes take time and there is no net increase in cell numbers, thus a lag phase is observed.
In the subsequent discussion, the numbers refer to the figure above. Once the appropriate enzymes for growth in a particular medium have been expressed cells begin to multiply. This period of maximal division can last for several hours or days, depending upon the organism, and is called the log or exponential growth phase (2).
Eventually the increase in cell number ceases, either because cells stop dividing or the rate of division equals the rate of cell death, resulting in a stationary phase (3). This is usually caused by limitation of a nutrient or the accumulation of a toxic waste product. Depending on the bacterium, stationary phase can last for several hours to many days.
The final chapter of a growth curve is the death phase (4). An exponential decrease in the number of organisms due to cell death occurs during this phase. Some microorganisms never experience a death phase or it is greatly delayed due to their ability to survive for long periods without nutrients.
Measurement of Bacterial Growth
Growth of microorganisms can be measured by following the increase in cell number or the increase in a cellular macromolecule such as DNA or protein. In most cases, the increase in cell number is determined. Cell numbers can be measured in a variety of ways. For this experiment we will use the viable plate count, which you are familiar with, and turbidometric measurement, which is was explained in the chapter on quantification of microorganisms.
So which wavelength of light do we use to measure cell numbers? Typically the shorter the wavelength the greater the sensitivity of the measurement. Some wavelengths cannot be used, however, because cellular constituents absorb light, not scatter them. For example proteins absorb light at 280 nm. Likewise the color of the medium affects absorbance. For this experiment we will be measuring the growth of E. coli in either a yellow or a clear medium, 600 nm works well. Beware, however, that the choice of wavelength must be considered for each experimental condition.
The sample is placed in a sample chamber. The chamber will contain a holder, an entrance for the selected wavelength, and an exit, leading to the detector. A critical piece of equipment used in the sample chamber is the cuvette. A cuvette is a special test tube that holds the sample. Cuvettes must be clean and free of aberrations, both of which could scatter light, resulting in inaccurate readings. Most good cuvettes are expensive and must be treated with care!
The actual operation of a spectrophotometer is much simpler than understanding its parts. There are a few general, rules of thumb, when using any spectrophotometer.
- Before you begin, be sure the wavelength selector is set for the wavelength of light you are going to use. This involves setting the correct wavelength on the selector, making sure the correct lamp is on for the wavelength you have selected and that you are using the correct cuvette.
- Make sure to zero the spectrophotometer. When this is performed you are adjusting the machine to 100% transmittance. This is done by using a sample that contains all components of a mixture except the component to be measured. For example, if you are measuring the growth of B. cereus in nutrient broth, the machine would be blanked with sterile, uninoculated nutrient broth. Realize that the machine is being blanked to read 100% T (or 0 absorbance) with a specific solution in a specific cuvette, with the cuvette in a specific orientation. This last consideration, nullifies any aberrations in the cuvette.
- With proper technique, nothing should be spilled into the spectrophotometer. If it is, clean it up and immediately notify an instructor. This type of spillage usually happens if cuvettes are filled over a spectrophotometer, a very bad habit to form!
- Clean the cuvette after each use by rinsing with distilled water and allowing to dry upside down in a test tube rack. For more stubborn stains use a dilute solution containing a mild soap (like Ivory). In rare cases, difficult blemishes can be removed with dilute acid (1-5%) or with ethanol. Never let a sample dry in a cuvette! Protein and nucleic acids form a strong bond with glass and can be impossible to remove.
- When measuring the turbidity of a cell suspension, absorbance values in the range of 0.1--0.8 are acceptable. Readings below 0.1 push the limits of the spectrophotometer, since it is not sensitive enough in that range. Absorbance values above 0.8 result in microorganisms casting shadows onto one another and not being seen by the spectrophotometer. If a reading is above this range, the culture must be diluted with sterile medium. If a reading is below this range, concentrate your culture using a centrifuge.
- When graphing growth versus time, you must plot absorbance on a log scale. Even though absorbance is a logarithmic unit, absorbance readings are proportional to cell mass which is increasing exponentially during growth.
6 - 6 Generating a growth curve
In this experiment, the classic bacterial growth curve will be demonstrated. A culture of Escherichia coli will be sampled at hourly or half-hourly intervals from the time of inoculation of the culture (0-time) through a 7 to 9-hour incubation period. The periodic samplings will be plated to determine viable counts (as colony-forming units per ml of culture) over the incubation period such that a growth curve may be plotted. From the graph, we may note the stages in the growth of the culture as it grows into the stationary phase. Additionally we will be able to determine the growth rate and generation time of E. coli under our experimental conditions from two points in the exponential phase of the graph.

Figure 5.16. Bacterial Growth. Graphing of bacterial growth on a linear scale
By definition, bacterial growth is cell replication - i.e., growth of the culture. Most species of bacteria replicate by binary fission, where one cell divides into 2 cells, the 2 cells into 4, the 4 into 8, etc. If this cell division occurs at a steady rate - such as when the cells have adequate nutrients and compatible growing conditions - we can plot numbers of cells vs. time such as on the graph at right. Before too long, we will need to extend the paper vertically as the population continues to double. For a culture where cells divide every 20 minutes, one cell can result in 16,777,216 (i.e., 224) cells after just 8 hours - barring nutrient depletion or other growth-altering conditions.

Figure 5.17. Bacterial Growth. Graphing of bacterial growth with cell number on a log scale.
If we were to convert our vertical axis to a logarithmic scale - as on the graph at right - we will not need as many sheets of graph paper, and we will find that a steady rate of growth is reflected as a straight line. (On the vertical axis, the same distance on the paper is covered with each doubling.) This type of graph paper is called semilogarithmic graph paper on which we will be plotting our class results. The numbers we plot will fall on the graph at the same place the logarithms of these numbers would fall when plotted on conventional graph paper.
The example below shows the type of graph we may obtain from our class data. We can plot both colony-forming units (CFUs) per ml and absorbance on the same graph, remembering that the absorbance units should also be on a logarithmic scale. Rather than "connecting the dots," we draw the best straight line among our CFU/ml plots to represent the phases of growth - lag, exponential, and the start of the maximum stationary phase.

Figure 5.18. Two measurements of growth. Example data showing a plot of cell number by VPC and by turbidity.
For the growth rate formula we are about to use, we need to choose two points on the straight line drawn through the exponential phase, also making note of the time interval between them. As we will be converting our numbers to logarithms for the formula, why not choose two points for which the logs are easy to obtain? (For example, the log of 1X10¹⁰ is simply 10.)
Higher CFU/ml = Xt = 1X10¹⁰ (at 5.75 hours)
Lower CFU/ml = X0 = 1X10⁸ (at 2.75 hours)
Time interval (in hours) between the 2 points = t = 3
Using the first formula, we find the growth rate which is the number of generations (doublings) per hour:

Figure 5.19. Caluclating the growth rate. Use this formula to determine the growth rate k
With the second formula, we find the generation time which is the time it takes for the population to double:

Figure 5.20. Generation time. The generation time is the reciprocal of the growth rate.
With a clear graph, one should be able to determine the generation time without the use of formulas. Just look for a doubling of the population and the time it takes for that to happen. For example - in the above graph - the time it takes to go from 3 X 10⁹ to 6 X 10⁹ appears to be approximately 30 minutes, which is close to the generation time determined above.
In preparation for this exercise, be sure to read the relevant material in your textbook, and look over the procedure below.
| Precautions regarding observance of aseptic technique:
|
Period 1
Materials
Samples (5-6 ml) which were taken at hourly or half-hourly intervals from a culture of E. coli growing in Nutrient Broth+0.2% yeast extract, incubated at 37°C on a shaker. These samples have been kept on ice for use in this experiment, and each pair will use one sample.
The following are provided for each pair of students:
7-9 nine ml dilution blanks
8 tubes of melted Plate Count Agar (PCA) in test tubes (15-20 ml/tube) - in 50°C water bath
8 empty, sterile petri dishes
Pipettors (P1000) and sterile tips
Spectrophotometer tube and spectrophotometer
Each pair will pick up one culture from the ice-water bath on the front table. Record the number on the tube. It represents the age of the culture at which time the sample was taken.
With the P1000 (blue) pipettor set at 1.0 ml, transfer 1 ml of the culture to the first nine ml dilution blank (for the first 1/10 dilution to work with in Step 5).
Aseptically dump the remainder of the culture into the small spectrophotometer tube (to work with in step 4).
With the culture in the spectrophotometer tube, one person in the pair will obtain and record the absorbance reading of the culture while the other begins the next step.
With additional dilution blanks, make dilutions as specified below. Inoculate 1 ml from each of the four specified dilutions into each of two petri plates; plate inoculations can be made concurrently with preparation of the dilutions.
The dilutions to be plated are as follows:
| For 0-hour through 2-hour sampling times: | 10-4, 10-5, 10-6, 10-7 |
| For 2.5-hour through 4.5-hour sampling times: | 10-5, 10-6, 10-7, 10-8 |
| For 5-hour through 9-hour sampling times: | 10-6, 10-7, 10-8, 10-9 |
For each plate, obtain a tube of melted PCA from the water bath and pour the contents into the plate. Mix the medium and inoculum by carefully swirling and allow the plates to solidify.
Incubate the plates inverted at 30°C until the next period.
Period 2
Each pair will determine the total plate count (no. of colony-forming units/ml of culture). Be sure you are counting colonies of all sizes. (E. coli typically produces small, lens-shaped colonies when growing below the surface.) Turn your result in to the instructor along with the absorbance reading. Be sure you have indicated the sampling time! Results will be compiled and presented next period.
For Your Assignment:
Plot the plate count data on semi-logarithmic graph paper. Rather than generating a growth curve by connecting the dots, draw the best straight lines through the lag and exponential phases. (Transitions between the growth phases can be rounded out.)
Determine the growth rate and generation time for the particular strain and cultural conditions in our experiment. Remember that the points you need to calculate these values are to be taken from the best straight line drawn through the exponential phase. Do not use individual data points from the class data. Also, be sure to indicate the proper units (gen/hr or hr/gen). Show your calculations!
Plot the absorbance readings on semi-logarithmic graph paper. Note any similarities in the graph generated and that for the plate count data. Both the absorbance and plate count plots can be made on the same graph. Do not use the absorbance readings for any calculations of growth rate or generation time.
6 - 6 Antibody tests
One important limitation to metabolic tests is that they almost always require the growth of the microbe in some medium and this takes at least 12-24 hours before a clear result is obtained. Faster results would speed diagnosis. A second limitation to metabolic tests is that a specific isolate under testing may have a mutation such that it is incapable of performing a metabolic conversion where the normal isolate of that species is proficient. For example, most strains of E. coli are capable of using lactose as a carbon source, but isolates of E. coli have been found that cannot utilize lactose. Finally, to clearly identify an isolate, it is often necessary to perform numerous tests. The preparation and use of all this media is time consuming and expensive.
Because of the limitations of metabolic tests, considerable effort has been made to find accurate, simple, and rapid alternatives. This research is starting to bear fruit, with the most popular methods being antibody tests and DNA methods, especially Figure 6-13 shows the steps of the TECRA reaction.
Here we present the TECRA reaction, explaining the theory behind how it works and a typical protocol for its use. The protocol was adapted from the technical material provided by BioTrace International.
This kit will be used for various experiments depending upon time and funding. The protocol is the same for both after the initial enrichment steps. These initial enrichment steps will be done according the FDA approved BAM. The majority of this section is modified from the instructions included with the TECRA kit.

Figure 7.13. The basis of TECRA.
TECRA reactions are a four step process that uses antibodies to detect various strains. Here is what is happening in each step
- High affinity "capture" antibodies specific for the test microbe have been adsorbed on the surface of the Removawells.
- If the test microbes antigens are present in the sample, they are captured by the antibodies. All other materials in the sample are washed away.
- The sandwich is completed by the addition of enzyme-labeled antibodies (Conjugate) specific for the test microbe.
- The presence of the test microbe is indicated when the bound conjugate converts the Substrate to a green color. Alternatively, test microbe, no green color.
Intended use
The TECRA® Visual Immunoassay (VIA) is a rapid and specific screening test for the in vitro detection of the species of interest in food, food-related and environmental samples after enrichment.
Following enrichment, at least 1 CFU of the species of interest in 25 grams of sample can be detected. Presumptive positives should be confirmed by standard methods. This is especially important in situations such as product recalls.
The TECRA® VIA utilizes antibodies which recognize all tested strains of the species of interest. This method has been shown to be at least as sensitive as standard culture and plating techniques and has virtually no cross-reactivity with other types of organisms.
The TECRA® VIA is an Enzyme-linked Immunosorbent Assay (ELISA) performed in a "sandwich" configuration.
Performing the Immunoassay:
- Ensure all kit components are at room temperature (20-25°C) before use.
- Transfer 0.5 ml of each enrichment into a labeled microfuge tube.
- Heat the tube for 15 minutes at 100 °C in the heating block.
- Open the pouch and remove the required number of wells from the sealing film, allowing one well for each sample (a positive and negative control are also necessary for comparison). Press the wells firmly into place in the holder.
- Using a new pipette tip for each sample, transfer 200 µl aliquots of the samples into individual wells. Cover the wells with plastic cling wrap film and incubate for 30 minutes at 35-37 °C
- NOTE: Thorough washing in these next steps is a critical step and is essential for a clear interpretation of the results.
- Dump out the liquid in the Removawell. Remove residual liquid by striking the holder firmly several times face down on a thick pile of absorbent paper towels. This is important for effective removal of sample residue.
- Completely fill each well with wash solution, taking care not to trap air bubbles in the bottom of the wells. Wash and completely empty the wells a total of 3 times as outlined above.
- Ensure the Removawells are empty before proceeding.
- Add 200 µl of Conjugate to each well. Cover the holder with plastic cling wrap film and incubate for 30 minutes at 35-37°C
- Empty the wells and wash them thoroughly a total of FOUR times (not three) using the sequence previously described in step 7
- Ensure the Removawells are empty before proceeding.
- Add 200 ml of Substrate to each well. Incubate at 20-25°C (room temperature). Color development tends to concentrate around the sides of the wells. Tap the holder gently to distribute the color evenly before reading the result.
- Incubate for 10 minutes, then read the results.
- Results can be read visually using the Color Card provided OR with a plate reader.
- If using the card, compare your sample to the card.
- If using a plate reader, perform steps 18-23
- The absorbance of the samples can be read at 414+10 nm using the plate reader. We will use the 415 nm filter.
- Dual wavelength instruments should be blanked against air and the second "reference" wavelength should be set at 490+10nm.
- After 10 minutes, add 200 ml of Stop Solution to each well. Tap the sides of the holder gently to mix the contents, then read the result.
For the test to be valid:
- The positive control must have an absorbance of at least 0.3 and the negative control must have an absorbance of less than 0.2.
- A sample is considered negative when the assay has proved valid and the sample well has a reading of less that 0.3.
- A sample is considered positive when the assay has proven valid and the sample well has a reading greater that or equal to 0.3.

Figure 7.14. Example of a TECRA reaction. A positive (left) and negative (right) TECRA reaction. The results can be observed qualitatively using a card or quantitatively using a plate reader. The card that comes with the TECRA kit is shown for reference.
6 - 6 Identification by DNA probes and primers
What metabolic tests are really sensing is the absence or presence of a set of enzymes inside the microbe that carry out a specific function. All enzymes are encoded in the genome (the DNA) of the microbe. It is therefore possible to detect the presence of the genes that codes for specific enzymes instead of detecting the metabolic products of that enzyme activity. DNA detection methods depend upon the hybridization of a short piece or pieces of synthesized DNA to the genome of the test species. These short pieces of DNA are called probes or primers depending upon the method. The DNA genome of the test species is extracted, often by simply boiling a small bit of culture of the microbe, and then exposed to the primer. Once bound, the primer is detected in some fashion, the most common method being by PCR. DNA detection has several advantages.
- Depending upon how the primer is designed and what the target is, the test can be specific to a species or even a subspecies, or it can detect multiple microbes. For example, a primer can be made to the shigga-like toxin of certain strains of E, coli, specifically identifying heamorrhaggic E. coli. On the other end of the spectrum, there are primers that have been created to conserved regions of the 16S rRNA of bacteria that will detect any bacteria present in a sample.
- A mutation that would inactivate an enzyme, and fail in a biochemical test, will often still be positive in an DNA detection method.
- With a well designed probe or primer a single DNA test can identify a microbe. Identification by metabolic tests requires a large number of tests to narrow it down to the species level.
Until a few years ago, detecting the presence of specific DNA sequences was much more difficult than performing metabolic tests. Even though there are advantages to using DNA tests, they remained something done in research labs for very different purposes. The emergence of PCR and specifically Real Time PCR (RT-PCR) is beginning to break down that barrier. Using RT-PCR, it is possible to detect the presence of a microbe in a sample in minutes to hours. Microbes can be detected at very low levels, sometimes just a few cells per gram of sample are detectable.
Real time PCR is a modification of the PCR protocol such that PCR fragments are rendered detectable by fluorescence, thus it become unnecessary to run an agarose gel to determine the absence or presence of a DNA fragment. Many kits are available to detect pathogens in food. However, UW-Madison uses a modified protocol that simulates the results one would obtain from a kit. Why are we not using a kit? Two reasons. First, they are expensive, costing $300-400 for 100 samples. Second, they have very high specificity. For example, the kit for hemorrhagic E. coli detects the labile toxin, which is responsible for many of the symptoms of the disease. Therefore, only the bona fide pathogen will work in the assay. While this is a good thing in the field, in a teaching laboratory it would require that you be given the real pathogen; probably not a good idea. Especially with hemorrhagic E. coli as it is believed that the infectious dose can be as low as 10 microorganisms.
In our assay, fluorescence is generated by the binding of SYBR green, a dye developed by Invitrogen. SYBR green is excited by light at 498 nm and emits light at 522 nm when returning to the ground state. The dye is highly specific for double stranded DNA, and has a much higher fluorescence when bound to it.
In RT-PCR, a PCR reaction is run in the presence of SYBR green. If a positive template is present, the PCR primers bind to it and create double stranded DNA (dsDNA). The SYBR green dye binds to this dsDNA. As the amplification proceeds, the concentration of dsDNA:SYBR green complex increases with the concentration of dsDNA. Specialized machines, RT-PCR thermocyclers, have been developed to measure the fluoresce coming out of PCR reactions after each cycle. If a positive template is present, a strong SYBR green fluorescence will be observed in the tube. Conversely, samples without a positive template will have a lower fluorescence. One caveat, SYBR green is non-specific and will bind to any dsDNA fragment present in solution. It is therefore important to perform a melting curve after the amplification to verify that the fragment obtained is the correct sequence. DNA sequences will have a unique temperature at which they melt, with the melting temperature dependent upon the specific primary sequence of the fragment. In most RT-PCR reactions, the correct fragment will have a unique melting temperature compared to any false positives that may have arisen in the tube. With a carefully designed experiment and given the right primers, it is possible to test for the presence or absence of any DNA sequence and therefore any desired microbe or set of microbes. Below is given a general protocol for extracting DNA and testing for various bacteria using RT-PCR. This protocol was adapted from the references listed at the end of this page.
Procedure
For a food or other natural sample, perform the following.
- The sample must first be washed and centrifuged at low speed to remove large particulates before harvesting the microbes. Resuspend 0.1 g of sample in 3 ml Buffer 1 (50 mM sodium phosphate buffer [pH 8], 0.1% Tween 80). Vortex vigorously for about 30 seconds.
- Spin the sample at 200 x g for 15 minutes. Carefully pipette off the supernatant into an Oakridge centrifuge tube and place the tube on ice
- Repeat steps 1 and 2 two more times on the original sample, pooling approximately 9 ml of supernatant.
- Centrifuge the 9 ml of supernatant at 15,000 x g @ 4°C for 10 minutes to pellet the cells. Resuspend the cells in 100 µl of sterile water.
For a colony to be tested, perform the following
- With a sterile loop, pick a single colony and resuspend it in 100 µl of sterile water.
For a broth or enrichment culture
- Remove 100 µl of sample and place it in a microcentrifuge tube. Centrifuge at 14,000 rpm (or at high enough velocity to pellet the cells) for 20 seconds. Resuspend the cell pellet in 100 µl sterile water.
Once processed continue from here
- Boil the sample at 100 °C for 10 minutes.
- Chill the sample on ice for 10 minutes. Centrifuge in a table top centrifuge for 1 minute and collect the supernatant. This liquid will serve as your source of template DNA.
- Prepare your real time PCR tube according to the following table.
Master mix is purchased from Promega corporation. It comes as a 2x concentration. The SYBR green dye is purchased from invitrogen. (the material for gel staining) and comes in a 10,000x concentration. It is used in PCR assays at 100,000 x dilution. A 10x solution is a 10,000-fold dilution of the SYBR green. The primers are used as a concentration of primer is 0.25 µm. We obtained the primers from genosys.
PCR test for Tm (°C) primer forward (µl) primer reverse (µl) master mix template DNA (µl) SYBR green dye (10x) (µl) double distilled water Melt temp E. coli 60 1.7 1.6 25 10 5 to 50 µl 87.5 Salmonella 55 2.4 2.9 25 10 5 to 50 µl 86 Listeria 2 1.8 25 10 5 to 50 µl 80 Below are the sequences of the primers used to detect each species, along with their expected length of the fragment that should be generated if amplification is successful.
E. coli Primers (340 bp) F: 5'-GTTAA TACCT TTGCT CATTG A-3' R: 5'-ACCAG GGTAT CTAAT CCTGT T-3' Salmonella primers (85 bp) F: 5'-CCTTT CTCCA TCGTC CTGAA-3' R: 5'-TGGTG TTATC TGCCT GACC-3' Listeria monocytogenes primers (98 bp) F: 5'- TCCGC AAAAG ATGAA GTTC-3' R: 5'-ACTCC TGGTG TTTCT CGATT-3' - The following thermal cycling conditions are an initial DNA denaturation step at 95 °C for 10 min followed by 45 cycles of denaturation at 95 °C for 15 s, primer annealing at the optimal temperature for 40 s, extension at 72 °C for 60 s.
- Finally, melt-curve analysis was performed by slowly heating the PCRs to 95 °C (0.3 °C per cycle) with simultaneous measurement of the SYBR Green I signal intensity.
References
- Jothikumar N, Wang X, Griffiths MW Real-time multiplex SYBR green I-based PCR assay for simultaneous detection of Salmonella serovars and Listeria monocytogenes. J Food Prot. 2003 66(11):2141-5.
- Erja Malinen, Anna Kassinen, Teemu Rinttila and Airi Palva (2003) Comparison of real-time PCR with SYBR Green I or 59-nuclease assays and dot-blot hybridization with rDNA-targeted oligonucleotide probes in quantification of selected faecal bacteria. Microbiology (2003), 149, 269-277

Figure 7.15. Running RT-PCR experiment. Samples are processed as described in the protocol and then mixed with template DNA, taq polymerase, dNTPs and primers. Each complete reaction is pipetted into in a 96-well rack (a) and placed into a RT-PCR system. The University of Wisconsin-Madison Bacteriology Department uses the Applied Biosystems 7500 Real-Time PCR System (b). The system is programmed using their software. Runs typically take about 1-2 hours to complete. Results consist of Amplification plots (c) and Melting Temperature curves (d). Final analysis consists of looking at what cycle fluorescence appeared and what the melting curve of each test looks like in comparison to the positive and negative control.
Figure 7.16. Interpreting RT-PCR. The table was generated by adding PCR primers specific for E. coli and running a RT-PCR reaction. Cycle threshold indicates the cycle at which the fluorescence detectedby the instrument passed a predetermined threshold, indicating the presence of a PCR product. Melting temperature is the temperature at which the amplified DNA double helix denatured into single strands. This is sequence specific. Any test PCR reaction should have approximately the same melting point as the positive control. Given this table of results, determine which of the 14 samples actually contained E. coli.
For more information on identifying and classifying bacteria, read the chapter on bacterial classification.
6 - 7 Examples of growth curve data and graphs
The data shown here was generated by growing E. coli in four different media and then comparing the results. Before you do anything, think about the various media and hypothesize about which condition would have the fastest growth rate. Then, use this data to prepare graphs of the four conditions. Once created, choose appropriate points and determine the growth rate and generation time of each culture.
Growth of E. coli in minimal medium + lactose at 37 °C.
| Time (hours) | VPC1 | VPC2 |
| 7.80 x 10⁶ | ||
| 1.0 | 1.08 x 10⁷ | |
| 2.0 | 3.20 x 10⁷ | |
| 2.5 | 6.40 x 10⁷ | |
| 3.0 | 2.02 x 10⁸ | |
| 3.5 | 3.56 x 10⁸ | |
| 4.0 | 9.60 x 10⁸ | 4.1 x 10⁸ |
| 4.5 | 3.60 x 10⁸ | |
| 5.0 | 9.50 x 10⁸ | 2.50 x 10⁸ |
| 5.5 | 1.83 x 10⁹ | 1.07 x 10⁹ |
| 6.0 | 1.05 x 10⁹ | |
| 6.5 | 1.41 x 10⁹ | |
| 7.0 | 1.03 x 10100 | |
| 7.5 | 1.00 x 10⁹ | |
| 24.5 | 4.20 x 10⁸ | |
| 25.5 | 1.00 x 10⁸ | |
| 26.5 | 7.00 x 10⁸ |
E. coli grown in Minimal medium + glucose
| Time | VPC1 | VPC2 |
| 0.0 | 1.20 x 10⁷ | |
| 0.5 | 1.13 x 10⁷ | |
| 1.0 | 1.03 x 10⁷ | 1.40 x 10⁷ |
| 1.5 | 2.48 x 10⁷ | 2.10 x 10⁷ |
| 2.0 | 6.00 x 10⁷ | |
| 2.5 | 8.40 x 10⁷ | |
| 3.0 | 1.66 x 10⁸ | |
| 3.5 | 3.30 x 10⁸ | |
| 4.0 | 2.90 x 10⁹ | 1.80 x 10⁹ |
| 4.5 | 6.20 x 10⁸ | 9.40 x 10⁸ |
| 5.0 | 7.50 x 10⁸ | 1.09 x 10⁹ |
| 5.5 | 2.00 x 10⁹ | 1.60 x 10⁹ |
| 6.0 | 1.70 x 10⁹ | 2.42 x 10⁹ |
| 6.5 | 2.00 x 10⁹ | 1.48 x 10⁹ |
| 7.5 | 3.48 x 10⁹ | |
| 8.0 | 4.00 x 10⁹ | |
| 12.0 | 4.10 x 10⁹ | |
| 16.0 | 3.70 x 10⁹ | |
| 20.0 | 8.00 x 10⁸ | |
| 24.5 | 1.25 x 10⁸ | |
| 26.5 | 1.23 x 10⁸ |
E. coli grown in Minimal medium + glycerol
| Time | VPC1 | VPC2 |
| 0.0 | 2.52 x 10⁷ | |
| 0.5 | 1.11 x 10⁷ | |
| 1.0 | 9.80 x 10⁶ | |
| 1.5 | 1.96 x 10⁷ | |
| 2.0 | 1.65 x 10⁷ | |
| 2.5 | 3.80 x 10⁷ | |
| 3.0 | 4.10 x 10⁷ | |
| 3.5 | 9.10 x 10⁷ | |
| 4.0 | 5.80 x 10⁷ | 1.50 x 10⁸ |
| 4.5 | 2.23 x 10⁷ | |
| 5.0 | 2.23 x 10⁷ | 4.10 x 10⁸ |
| 5.5 | 6.20 x 10⁸ | 5.10 x 10⁸ |
| 6.0 | 5.00 x 10⁸ | 7.10 x 10⁸ |
| 6.5 | 1.16 x 10⁸ | 2.48 x 10⁸ |
| 7.5 | 1.90 x 10⁸ | |
| 24.5 | 3.56 x 10⁸ | |
| 25.5 | 8.60 x 10⁸ | 4.10 x 10⁸ |
| 26.5 | 6.30 x 10⁸ | 6.20 x 10⁸ |
E. coli grown in Rich medium (Nutritent Broth + Glucose + Yeast Extract)
| Time (hours) | VPC1 | VPC2 |
| 0.0 | ||
| 0.5 | 5.01 x 10⁶ | |
| 1.0 | 4.90 x 10⁶ | |
| 1.5 | 5.20 x 10⁶ | |
| 2.0 | 1.46 x 10⁸ | |
| 2.5 | 8.35 x 10⁷ | |
| 3.0 | 3.85 x 10⁸ | |
| 3.5 | 5.50 x 10⁸ | |
| 4.0 | 5.55 x 10⁸ | |
| 4.5 | 9.10 x 10⁸ | |
| 5.0 | 8.40 x 10⁸ | |
| 5.5 | 9.10 x 10⁸ | |
| 6.0 | 1.10 x 10⁹ | |
| 6.5 | 3.90 x 10⁹ | 7.00 x 10⁸ |
| 7.0 | 7.40 x 10⁸ | |
| 7.5 | 7.70 x 10⁸ | |
| 25.5 | 5.00 x 10⁸ | |
| 26.5 | 7.70 x 10⁸ |
After looking at the data and determining your growth rates, did your actual results match your hypothesis? In either case explain your reasoning.
6 - 8 Summary of bacterial growth and nutrition
Making media
Proper care and maintenance of microorganisms is essential for any successful experiments, be they in academic research, industry or the health field. If you do not understand what a microbe requires for growth it is very difficult to study its properties. Even in the field of environmental microbiology, where unculturable microbes are sometimes studied, the ultimate goal will be to bring strains into the laboratory where they can be examined in detail. Microbes, despite their great metabolic diversity, have the same basic requirements for growth; a carbon source, an energy source and a source of reducing power. Carbon can come from CO2 or organic molecules, energy will come from light or chemicals and reducing power is obtained from organic or inorganic chemicals.
A successful medium for a target microbe must contain all the nutrients it needs for growth in a form that the microbe can utilize. These are mixed in an aqueous solution and then sterilized, most often by autoclaving. Ingredients that cannot stand the heat of the autoclave are often filter sterilized. Once sterilized, all the components of a medium are mixed together and the medium is then inoculated with a source of bacteria.
Oxygen relationships
One of the more important properties for a microbe is the relationship of the microbe toward oxygen. Organisms capable of utilizing oxygen in their metabolism are aerobes, those that cannot are called anaerobes. Microbes can be separated into 5 categories based upon their use of oxygen. Strict aerobes require oxygen for their growth, while strict anaerobes cannot survive in the presence of oxygen. Facultative anaerobes can grow in the absence of oxygen, but grow better in its presence. Aerotolerant anaerobes have mechanisms to protect themselves from oxygen, thus being able to grow in its presence or absence, but do not use oxygen in their metabolism. Finally microaerophiles require oxygen for their metabolism, but cannot survive at atmospheric levels of oxygen (21% O2). Microaerophiles are restricted to narrow bands in between aerobic and anaerobic habitats, where the oxygen gradient is within an acceptable range. Some examples would be in a lake or pond, or wet soil.
Measuring bacterial growth and growth curves
For unicellular orgnaisms, growth is normally thought of as an increase in number. Microbes can growth very rapidly and the most heavily studied microbes grow by binary fission. A characteristic growth pattern is found when microbes are growth in a closed vessel. Initially, the microbe adapts to a fresh medium and no growth is observed. This is called lag phase. The microbe then begins dividing and the increase in population occurs by a geometric progression, resulting in explosive growth until nutrients are used up or toxic end products accumulate. This is termed exponential growth phase. At this stage growth stops and stationary phase begins. The population remains constant, sometimes for long periods of time. Eventually, cells accumulate damage and begin to die. The decrease in population, called death phase, occurs exponentially.
The rate of growth can be calculated by determining the cell number at different times. The growth rate (k) is a measure of how rapidly the cells are dividing, the faster cells are growing, the higher the growth rate will be.